I. Introduction: Unlocking the Hidden Story in Your Personal Health Data
Imagine this common scenario. For years, your annual check-up results return with gentle reassurance: "Everything looks fine; all numbers are within the normal range." Yet, a slow, steady story is unfolding within your lab reports. Your fasting glucose levels, while never technically "diabetic," have been climbing a few points annually. Your HDL cholesterol is on a quiet, persistent decline. These subtle, long-term health trends, invisible in any single snapshot, can form the prologue to a major health event—one that feels sudden but was, in fact, years in the making.

This is the hidden narrative in your personal health data. While a single test provides a snapshot, the trends in your biomarkers over time are a far more powerful predictive health tool. We are witnessing a paradigm shift from a reactive model toward a proactive, data-driven healthcare approach focused on preventative health and extending healthspan, as emphasized in recent public health research on predictive models.
II. Biomarkers 101: Understanding Your Body's Dashboard
A biomarker is any measurable indicator of a biological state. Think of them as your body’s nuanced dashboard signals. Key health biomarkers include: * Blood Glucose / Fasting Glucose: A primary indicator of metabolic health and insulin resistance. * LDL Cholesterol: Often called "bad" cholesterol, linked to cardiovascular risk. * hs-CRP (High-sensitivity C-reactive protein): A key marker of systemic inflammation. * Vitamin D Levels: Crucial for immune function and bone health. * Resting Heart Rate & Heart Rate Variability (HRV): Indicators of cardiovascular fitness and autonomic nervous system balance. Tracking HRV is a powerful tool for this, as detailed in our guide on how to unlock peak performance and stress resilience with Heart Rate Variability.
The critical flaw in traditional check-ups is the "Snapshot Fallacy". A doctor compares today’s results to a broad laboratory "normal range." This range masks individual reality. A value at the high end of "normal" for you could be a red flag if your personal baseline is typically much lower.
"Normal Range" vs. Your "Optimal Health Zone"
The standard lab range is a statistical aggregate. Your personal optimal zone is where you function and feel best. For example, a fasting glucose of 99 mg/dL is "normal," but a consistent rise from 85 to 99 over five years signals a critical metabolic trend demanding attention, long before reaching the diabetic threshold.
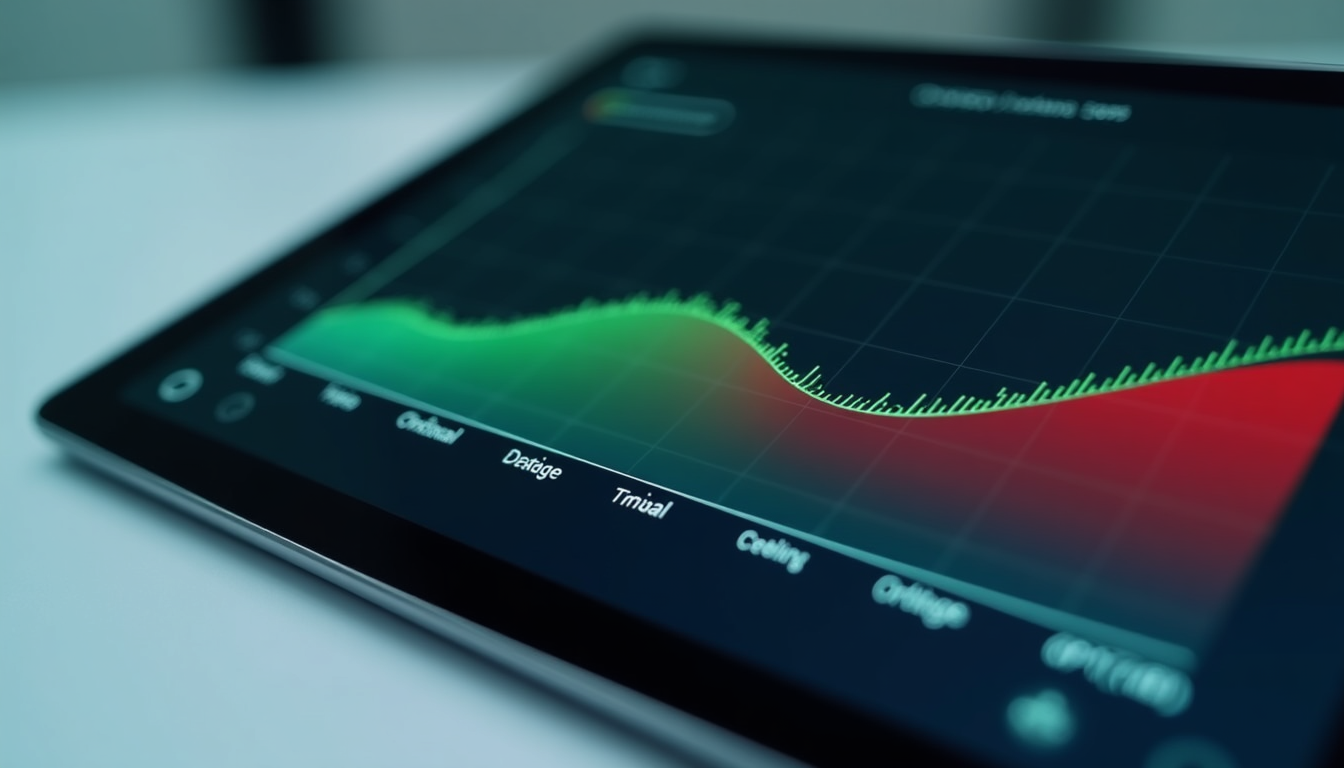
This underscores the core concept of personalized health analytics: establishing your Personal Health Baseline.
III. The Predictive Power of Your Health Trendline
In health data, the direction of your biomarker trends often matters more than a single data point. A creeping rise or fall reveals your health trajectory, forming the cornerstone of predictive healthcare. Research highlights that tracking these disease progression trajectories is key for early risk stratification.
Real-World Case Studies in Trend Analysis
Case Study 1: Tracking Metabolic Health Longitudinal tracking of fasting glucose and HbA1c (Hemoglobin A1c) can reveal a progression toward insulin resistance years before a Type 2 diabetes diagnosis. An upward trend allows for early lifestyle intervention, such as strategies to master metabolic flexibility and switch fuels for more energy.
Case Study 2: Assessing Cardiovascular Risk A static LDL reading is limited. Tracking advanced lipid markers like ApoB, alongside trends in blood pressure and hs-CRP, creates a dynamic picture of heart health. A gradual increase is a clearer risk signal.
Case Study 3: Monitoring Chronic Inflammation Low-grade chronic inflammation drives many diseases. Tracking hs-CRP longitudinally can show a "creeping rise," serving as an early warning sign to address diet, stress, or sleep.
"Biomarker-based predictive models are a cornerstone for the early identification and management of chronic conditions, focusing on extending healthspan."
— Frontiers in Public Health
IV. Your Health Tracking Toolkit: How to Monitor Trends
Building your personal health timeline is accessible through multi-modal data integration, combining sources for a comprehensive view.
Leveraging Personal Health Technology: * Wearable Devices: Fitness trackers log resting heart rate, HRV, sleep, and activity. Continuous Glucose Monitors (CGMs) offer real-time metabolic insight. * At-Home Testing Kits: Convenient options for blood, saliva, and gut microbiome testing. Understanding this data is key, as explored in our article on personalized microbiome optimization for unlocking holistic health. * Digital Health Platforms & Health Apps: Aggregate lab results, wearable data, and lifestyle logs to visualize health correlations.
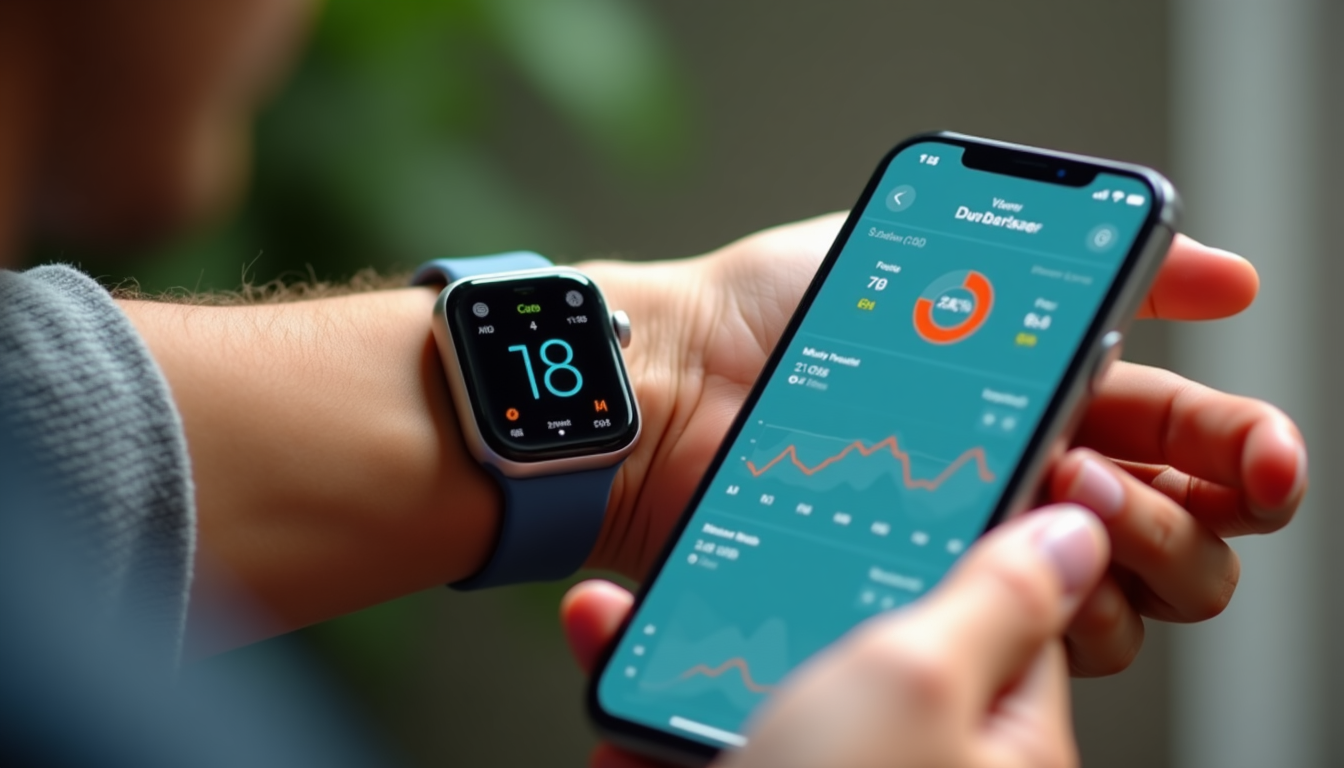
The Essential Role of Standardized Bloodwork: Technology complements, but doesn't replace, clinical labs. Work with your doctor for a consistent periodic testing schedule. Consistency with the same laboratory ensures your longitudinal health data is accurate.
🔬 Quantitative Blood Tests
Core biomarkers (lipids, glucose, inflammation) provide objective, trackable data for establishing your baseline and trends.
📊 Wearable & Behavioral Data
Continuous data on sleep, activity, and HRV adds context, showing how lifestyle impacts your biomarker trends.
V. From Data to Action: Interpreting Your Health Trends
Health data interpretation turns insights into actionable health strategies.
Collaborating with a Healthcare Professional: A knowledgeable provider interprets trends within your full health context, co-creating a personalized health plan.
Lifestyle as Your Primary Lever: Trend tracking shows the data-backed impact of choices. * Nutrition & Diet: Observe how dietary changes affect your lipid panel or glucose trends. * Exercise & Physical Activity: Track improvements in metabolic fitness or reductions in inflammatory markers. * Stress Management & Sleep Quality: Correlate dips in HRV with periods of high stress or poor sleep.
This is precision prevention in action. An unfavorable trend is an early warning sign—a chance to implement targeted strategies and change your health trajectory.
Gather Your Baseline Health Data
Collect past lab results. Commit to consistent future testing to build your timeline.
Visualize Your Biomarker Trends
Use a digital platform or spreadsheet to plot key biomarkers over time. Look for directional patterns.
Consult & Create an Action Plan
Review trends with your provider to design a targeted, personalized intervention strategy.
VI. Navigating Challenges in Personal Health Analytics
This approach has hurdles that require mindful navigation.
- Data Anxiety & Over-Tracking: Focus on long-term trends (months/years), not daily fluctuations, to avoid overwhelm.
- Data Quality & Standardization: Data heterogeneity is a challenge. For accurate trend analysis, use the same labs and methodologies when possible.
- Privacy & Data Ownership: Understand the data policies of your chosen tools and platforms.
- The Health Equity & Access Gap: This approach requires resources. High implementation costs and limited model generalizability across diverse populations pose significant hurdles to equitable adoption.
VII. The Future: Predictive Analytics and Personalized Health Forecasting
We are at the dawn of a revolution in personalized health forecasting.
- AI and Machine Learning in Healthcare: These technologies analyze complex data from multi-omics, wearables, and EHRs to identify subtle, non-linear biomarker associations.
- Longitudinal Studies & Dynamic Indicators: Future progress relies on more longitudinal health data and dynamic indicators.
- Improving Trust in Predictive Models: Solutions include standardized governance and enhancing model interpretability for clinicians and users.
- The Empowered Patient-Provider Partnership: The goal is a collaborative relationship, co-creating a dynamic, personalized health optimization plan.

VIII. Conclusion: Author Your Own Health Story
The power of personal biomarker trend tracking lies in a fundamental shift: from viewing health as static snapshots to reading it as a dynamic narrative. Your body communicates through data. Learning to interpret the direction of its trends empowers you to become an active author of your long-term health.
The journey begins with a single step: start building your health timeline today.
Your First Step Towards Proactive Health
Actionable Takeaway: Request your past lab results from your doctor's office. Schedule a conversation about establishing a consistent testing schedule for your key biomarkers. Begin visualizing your unique story. Ready to take control? You can start tracking and correlating all your health data in one place by taking the first step to register for our health tracking platform.
Your future self will thank you for the early health insights that allowed you to write a longer, healthier, and more vibrant chapter of your life. ```